Update… and that’s why you don’t publish until your brain stops working…
I’ve updated the script to support a colour picker, and any number of colours (up to the number of values in the selected property)
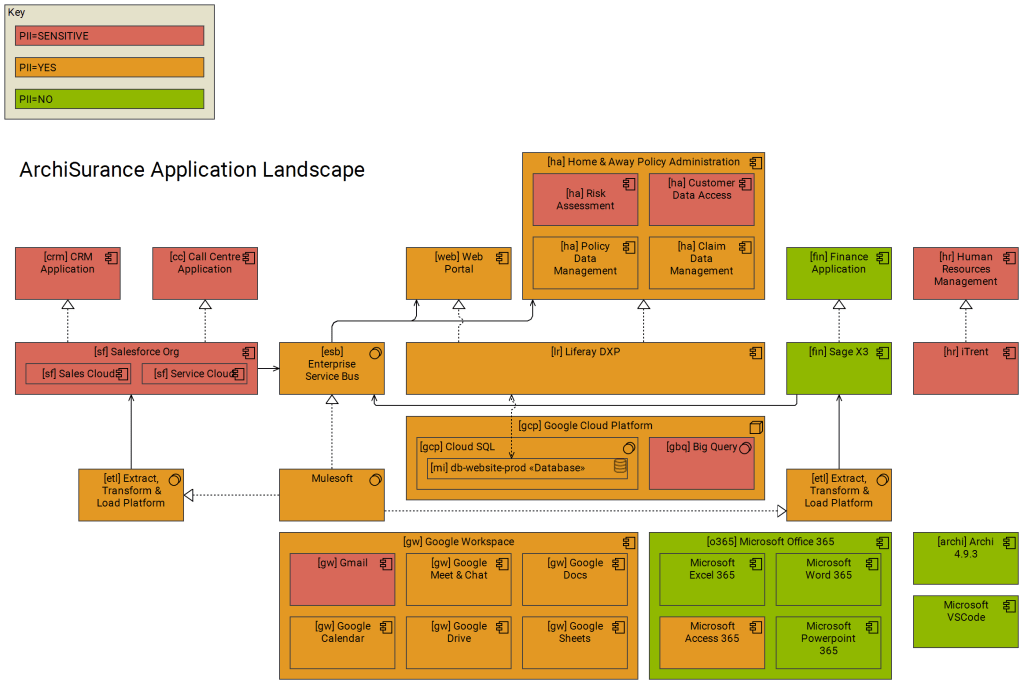
I recently had a request to highlight all applications which store Personally Identifiable Information (PII) as well as “Sensitive PII” in use within an organisation. I already had the data available as “Properties” stored against each element within a Landscape view. There are a number of artefacts that could be produced from this, firstly I could export the view as a CSV, import this into a spreadsheet, and display the data as a table, however, I also wanted to provide a “heat map” view of the landscape, red being “Sensitive PII”, amber being “PII” and green being “none”.
Rather than spend the time in Archi reviewing each property and manually applying the colour…
View original post 324 more words


Leave a comment